Lots of business owners have Google Analytics on their website, but they look at it once every six months and even then don’t know what to do with the numbers. Yet web analytics is one of the few tools that tells you for free where your customers come from, what interests them and where you lose them. In this article, you’ll learn what web analytics is, how it works, where it tends to be inaccurate and how to use it to grow your business.
What web analytics is
Web analytics is collecting, evaluating and interpreting data about how visitors behave on your website. The goal isn’t pretty charts, but better decisions: what to invest in, what to change on your website and what to stop doing.
It works with two types of data:
- Quantitative data – numbers: visits, traffic sources, time on page, conversions. They tell you what is happening.
- Qualitative data – customer feedback, surveys, session recordings, usability tests. They tell you why it’s happening.
You get the best picture when you combine both. The numbers show that people abandon their cart. Only a conversation with a customer reveals that the shipping cost put them off.
How analytics works
Your website has a tracking code installed, most often Google Analytics 4. When a visitor comes to a page, the code records what they do: which pages they viewed, what they clicked, whether they submitted a form or made a purchase. The data is sent to the analytics tool, where you see it in reports.
GA4 records everything as events. A page view, a click, a scroll and a purchase are all events. That lets you measure exactly the steps that matter for your business.
In Europe, cookie consent is part of the picture too. A visitor who declines tracking shows up in the data only partially or not at all. That’s another reason to read analytics as a trend, not as precise bookkeeping.
Which metrics to track
Don’t track everything. Pick three to five metrics that tie directly to your goals.
- Online store: conversion rate, average order value, revenue by traffic source, abandoned carts.
- Service business: number of inquiries and calls, where they come from, traffic to your service and pricing pages.
- Local business: clicks on your phone number and directions, bookings, traffic from your region.
Use the other metrics to look for causes when your main numbers change. We cover which numbers matter and which are just for show in our article on key metrics in online marketing.
How analytics helps your business grow
You find out which channels really make money
Facebook may bring you lots of visits, while orders come mainly from search or email. Without analytics, you’d invest equally in every channel. With it, you move your money to where it brings in customers.

You find the spots where you lose customers
Analytics shows on which page or at which checkout step people leave. Maybe the form is too long, the button doesn’t stand out or the page is slow on mobile. Every finding like that is a chance to win more customers without paying for more traffic. More in our article how to raise your conversion rate without more traffic.
You decide based on tests, not impressions
You can compare two versions of a landing page, two button texts or two offers and measure which works better. Instead of “I like this one more” debates, you get an answer from the data.
You improve your content
You’ll see which articles and pages people read, which ones bring in customers and which ones nobody cares about. That tells you what to write about next and what to update.
Example: what the data can reveal
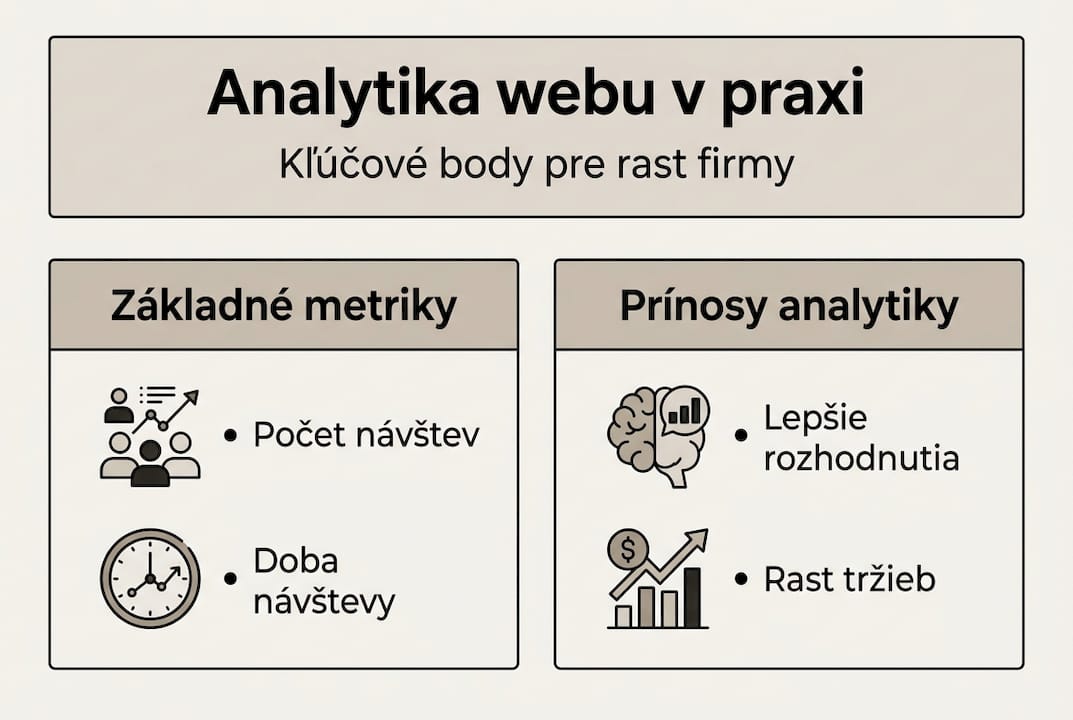
Picture an online store selling homemade cosmetics. The owner feels that Instagram drives most of her sales, because that’s where she gets the most reactions. Analytics, however, paints a different picture: lots of people come from Instagram, but few of them buy. Orders come mainly from search and from emails to regular customers.
The second finding: on mobile, many people leave at the shipping step, where they only then find out the shipping cost. The fix is simple – show the shipping cost right on the product page.
The owner doesn’t have to drop Instagram. But now she knows it mainly serves to build relationships, and she moves her ad budget to where the orders happen.
Useful tools besides Google Analytics
- Google Search Console – shows which searches your website appears for, how many people click and whether Google has technical problems with your site.
- Microsoft Clarity – free heatmaps and session recordings that show you where people get stuck.
- Your online store or booking system stats – actual orders and revenue to compare against your analytics data.
- Ad platform reports – Google Ads and Meta Ads Manager show campaign performance, but each one mainly looks out for itself.
Why data is never completely accurate
Even well-configured analytics has its limits. The most common problems:
- Duplicate tracking – the code is on your website twice, for example in the theme and through Google Tag Manager, and the numbers are inflated.
- Bots – some visits aren’t made by people. GA4 filters out known bots automatically, but not all of them.
- Internal traffic – you and your coworkers get counted as customers.
- Declined cookies and ad blockers – some visitors aren’t measured at all.
- Redirects and payment gateways – when a customer goes off to a payment gateway, the information about where they came from can get lost.
What to do about it:
- regularly test your tracking in debug mode (DebugView in GA4),
- set up an internal traffic filter,
- manage all your tracking codes in one place, ideally in Google Tag Manager,
- keep a log of setting changes so you can explain sudden jumps in the data,
- compare the number of orders in analytics with the actual orders in your system.
Browser tracking versus server tracking
- Browser tracking (client-side) – the classic approach, where the code runs in the visitor’s browser. It’s simple and cheap, but more vulnerable to blocking and browser restrictions. For most small websites, it’s enough.
- Server tracking (server-side) – data passes through your server first and only then goes to your tools. It’s more accurate and gives you more control over your data, but it’s technically more demanding and comes with ongoing server costs.
- A combination of both – part of the tracking runs in the browser, part on the server. It makes sense for bigger online stores and higher ad budgets.
Small businesses can safely start with GA4 in the browser. Once your ad revenue grows and every unmeasured conversion means less well-tuned campaigns, it’s worth considering server-side tracking. More in our article on server-side tracking.
How to get started with analytics
- Make sure you have access to GA4 and that the account belongs to your business.
- Check that the tracking code is on your website only once.
- Set up key events – an order, an inquiry, a phone call. You’ll find a detailed guide in our article how to set up tracking in Google Analytics 4.
- Pick three to five main metrics and create a simple monthly report.
- Once a month, compare the numbers with the previous period and write down what you’ll change.
Frequently asked questions
How often should I look at my analytics?
For a smaller website, a weekly check of the main numbers and a more detailed look once a month is enough. During campaigns or after bigger website changes, watch the data more often, but don’t draw conclusions from a single day.
Can analytics replace customer feedback?
No. Analytics tells you what’s happening; customers tell you why. A combination of numbers and conversations brings the best results.
What should I do when the data is clearly inaccurate?
Check whether the code is installed twice, set up an internal traffic filter and test your tracking with a test order or form. If the problem persists, get a tracking audit.
I don’t have time to analyze data. What can I do?
Set up an automated email report with a few key numbers and spend a few minutes on it each week. If you don’t have capacity even for that, someone else can take over the analysis and sum up once a month what the data shows.
Want to see which parts of your marketing really bring in customers? Get in touch – we’ll check your tracking, set up conversions and prepare a report you can actually make decisions with.